
IBM SPSS Statistics is a handy and powerful statistical software which allows you to quickly analyse your data using simple point-and-click interface. That means you can find an option to click from a drop-down menu for a statistical analysis technique you would like to perform. For example, to calculate the mean and standard deviation or to fit a regression model you can find the option from a drop-down menu. There is option for writing syntax as well for performing any statistical analysis. A syntax is a series of codes we write on a SPSS script to perform a single or multiple tasks. The benefit of writing syntax is that you can repeat and reproduce the same analysis anytime your syntax file is stored in a safe place. This is not a free software therefore you have to buy a licence for it. This can be used in Windows or MacBook.
For this module I have used the example data sets provided by the Sheffield University’s Mathematics and Statistics Help centre. I thank them to make the data freely available.
When you double click the SPSS icon you will see like the following figure.
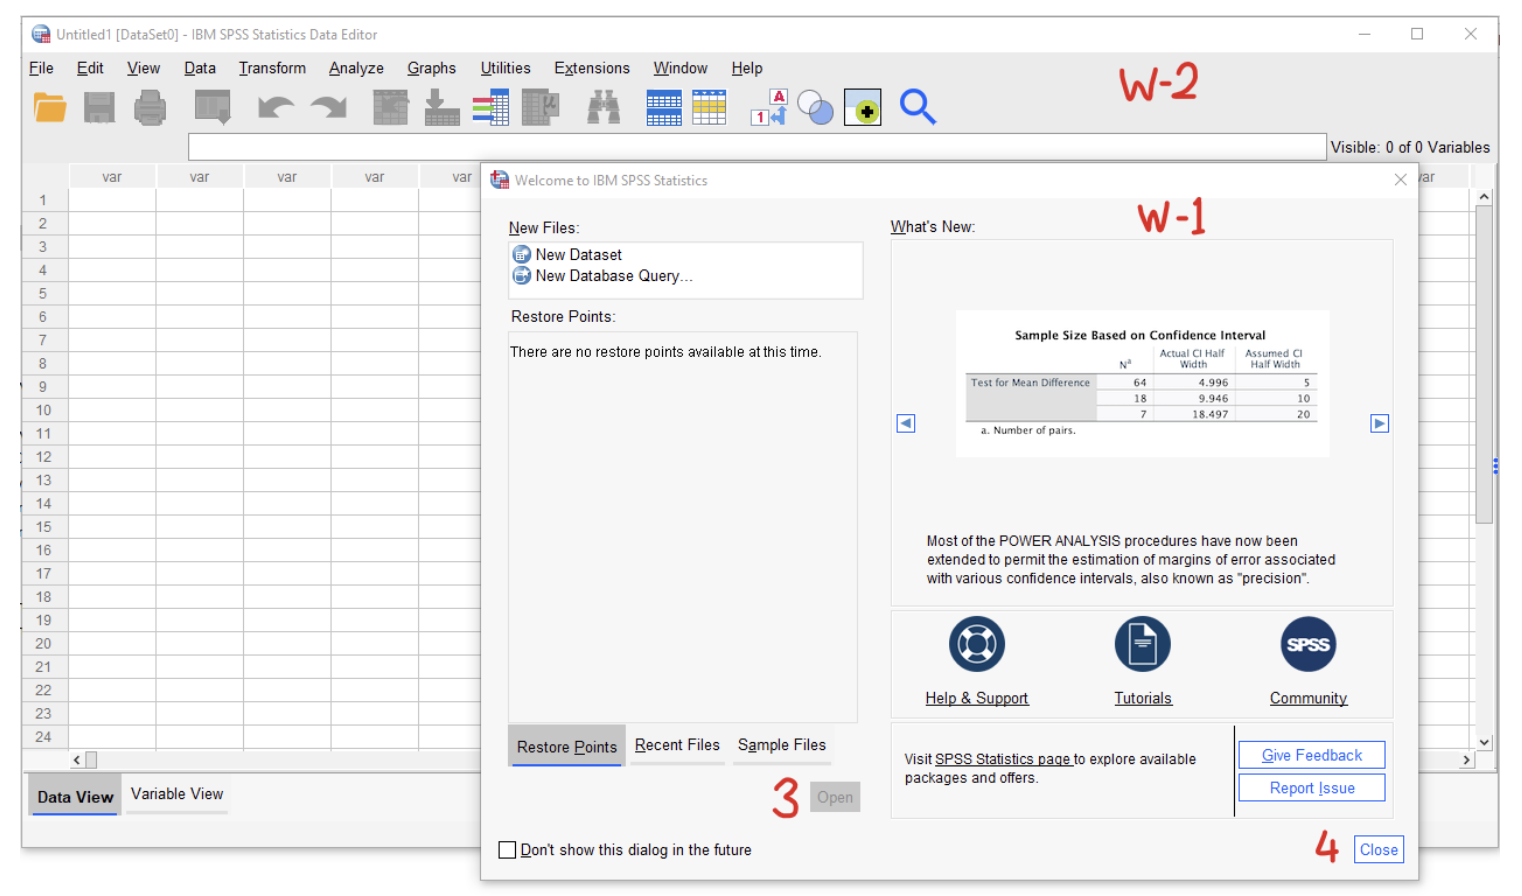
Figure 1 SPSS first look.
There are two windows (marked in red as W-1, W-2) opened. You can open a data file stored in your computer using the open button (marked in red as 3) from the windows 1. You will find name of the recent data file used from the window 1. I prefer to close the W-1, you can do close yours too with no problem by clicking close button (marked in red 4) and open your data set using the window 2.
In the second window, you will see two buttons in the bottom left corner as
Data View and Variable View.
By clicking the Variable View you will see the variable names, their types, labels, values, number of missing data etc. and by clicking the Data View you will see the data spreadsheet with values. It is good practice to see the Variable View first to get idea about the data set. Once you have imported a data file or run some command to do some statistics another window called output window will be opened automatically. In the output window you will find all the output of your analysis. From the output window you can copy and paste the tables and graphs in your report which is usually an MS word file.